Run inference on time series of Sentinel-2 images#
Last Modified: 04-12-2023
Author: Gonzalo Mateo-García
This notebook shows how to query time series of images of Sentinel-2 over an area of interest (AoI) between two dates using the Google Earth Engine. Hence to run this notebook you a Google Earth Engine account.
We will run the clouds-aware flood segmentation model proposed in:
E. Portalés-Julià, G. Mateo-García, C. Purcell, and L. Gómez-Chova Global flood extent segmentation in optical satellite images. Scientific Reports 13, 20316 (2023). DOI: 10.1038/s41598-023-47595-7.
We show how to export those images, run inference, vectorise the segmentation output and show the results in an interactive map:
Video with the expected output results
Note: If you run this notebook in Google Colab change the running environment to use a GPU.
from datetime import datetime, timedelta, timezone
import geopandas as gpd
import pandas as pd
import ee
import geemap.foliumap as geemap
from ml4floods.data import ee_download
from shapely.geometry import mapping, shape
import matplotlib.pyplot as plt
from georeader.readers import ee_query, ee_image
from huggingface_hub import hf_hub_download
from ml4floods.scripts.inference import load_inference_function
from ml4floods.models.model_setup import get_channel_configuration_bands
from georeader.readers import S2_SAFE_reader
from georeader.save import save_cog
from ml4floods.scripts.inference import vectorize_outputv1
from georeader import plot
from tqdm import tqdm
from georeader.rasterio_reader import RasterioReader
from georeader.geotensor import GeoTensor
import numpy as np
import matplotlib.colors
import warnings
import torch
import os
Step 1: Config AoI and dates to search for S2 images#
You can test this notebook on a different AoI and dates, just change those variables in the cell bellow for this.
date_event = datetime.strptime("2021-02-12","%Y-%m-%d").replace(tzinfo=timezone.utc)
date_start_search = datetime.strptime("2021-01-15","%Y-%m-%d").replace(tzinfo=timezone.utc)
date_end_search = date_start_search + timedelta(days=45)
area_of_interest_geojson = {'type': 'Polygon',
'coordinates': (((19.483318354000062, 41.84407200000004),
(19.351701478000052, 41.84053242300007),
(19.298659824000026, 41.871157520000054),
(19.236388306000038, 41.89588351100008),
(19.22956438700004, 42.086957306000045),
(19.327827977000027, 42.09102668200006),
(19.778082109000025, 42.10312055000003),
(19.777652446000047, 41.97309238100007),
(19.777572772000042, 41.94912981900006),
(19.582705341000064, 41.94398333100003),
(19.581417139000052, 41.94394820700006),
(19.54282145700006, 41.90168177700008),
(19.483318354000062, 41.84407200000004)),)}
area_of_interest = shape(area_of_interest_geojson)
Step 2: Plot cloud coverage of available S2 image over AoI and search dates#
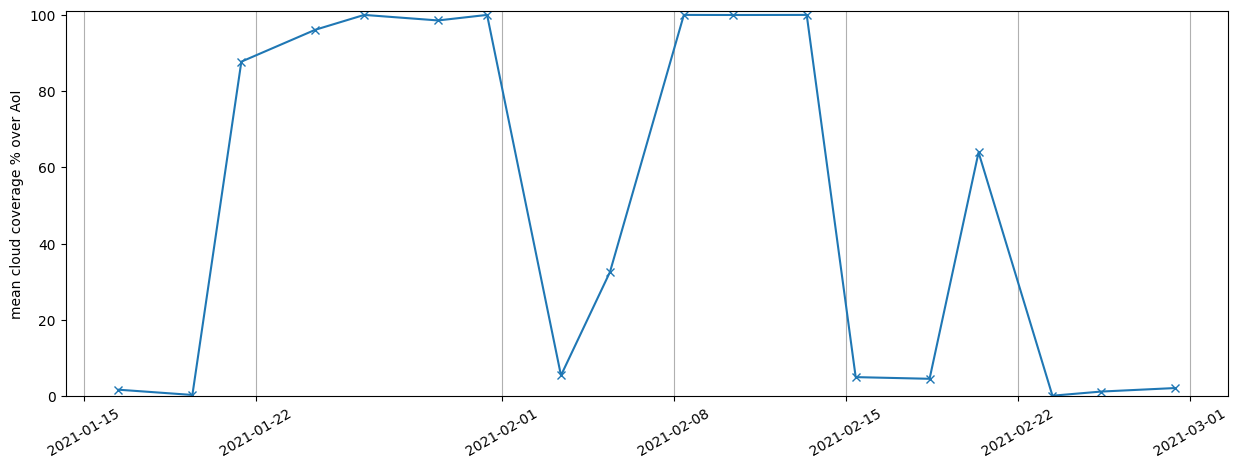
Next cell obtains the time series of S2 images over the provided AoI. This is a ee.ImageCollection object (img_col variable). Afterwards it obtains for each image the time of acquisition (system:time_start), the number of valid pixels (valids), and the average cloud probability (cloud_probability) in a pandas DataFrame (img_col_info_local). With this dataframe we plot the average cloud probability.
The cloud probability is obtained from the s2cloudless model which is available in the Google Earth Engine as an independent collection.
ee.Initialize()
# This function returns a GEE collection of Sentinel-2 and Landsat 8 data and a Geopandas Dataframe with data related to the tiles, overlap percentage and cloud cover
img_col_info_local, img_col = ee_query.query(
area=area_of_interest,
date_start=date_start_search,
date_end=date_end_search,
producttype="S2",
return_collection=True,
add_s2cloudless=False)
# Grab the S2 images and the Permanent water image
n_images_col = img_col_info_local.shape[0]
print(f"Found {n_images_col} S2 images between {date_event.isoformat()} and {date_end_search.isoformat()}")
plt.figure(figsize=(15,5))
plt.plot(img_col_info_local['utcdatetime'], img_col_info_local['cloudcoverpercentage'],marker="x")
plt.ylim(0,101)
plt.xticks(rotation=30)
plt.ylabel("mean cloud coverage % over AoI")
plt.grid(axis="x")
/home/gonzalo/mambaforge/envs/ml4floods2/lib/python3.10/site-packages/geopandas/geoseries.py:645: FutureWarning: the convert_dtype parameter is deprecated and will be removed in a future version. Do ``ser.astype(object).apply()`` instead if you want ``convert_dtype=False``.
result = super().apply(func, convert_dtype=convert_dtype, args=args, **kwargs)
Found 18 S2 images between 2021-02-12T00:00:00+00:00 and 2021-03-01T00:00:00+00:00

DataFrame with date of acquisition, averaged cloud probability and percentage of valid pixels.
img_col_info_local.columns
Index(['geometry', 'cloudcoverpercentage', 'gee_id', 'proj',
'system:time_start', 'collection_name', 'utcdatetime',
'overlappercentage', 'solardatetime', 'solarday', 'localdatetime',
'satellite'],
dtype='object')
Step 3: Display S2 images over the AoI#
In the next cell we loop over the available S2 images and show those with low cloud coverage using the geemap package. If you see this notebook in the tutorial web page you will not seen the images; however if you run this cell with access to the GEE you’ll be able to see the Sentinel-2 images in the interactive map!
import geemap.foliumap as geemap
import folium
tl = folium.TileLayer(
tiles="https://mt1.google.com/vt/lyrs=s&x={x}&y={y}&z={z}",
attr='Google',
name="Google Satellite",
overlay=True,
control=True,
max_zoom=22,
)
m = geemap.Map(location=area_of_interest.centroid.coords[0][-1::-1],
zoom_start=8)
tl.add_to(m)
img_col_info_local["localdatetime_str"] = img_col_info_local["localdatetime"].dt.strftime("%Y-%m-%d %H:%M:%S")
showcolumns = ["geometry","overlappercentage","cloudcoverpercentage", "localdatetime_str","solarday","satellite"]
colors = ["#ff7777", "#fffa69", "#8fff84", "#52adf1", "#ff6ac2","#1b6d52", "#fce5cd","#705334"]
# Add the extent of the products
for i, ((day,satellite), images_day) in enumerate(img_col_info_local.groupby(["solarday","satellite"])):
images_day[showcolumns].explore(
m=m,
name=f"{satellite}: {day} outline",
color=colors[i % len(colors)],
show=False)
# Add the S2 data
for (day, satellite), images_day in img_col_info_local.groupby(["solarday", "satellite"]):
if images_day.cloudcoverpercentage.mean() >= 50:
continue
image_col_day_sat = img_col.filter(ee.Filter.inList("title", images_day.index.tolist()))
bands = ["B11","B8","B4"] if satellite.startswith("S2") else ["B6","B5","B4"]
m.addLayer(image_col_day_sat,
{"min":0, "max":3000 if satellite.startswith("S2") else 0.3, "bands": bands},
f"{satellite}: {day}",
False)
aoi_gpd = gpd.GeoDataFrame({"geometry": [area_of_interest]}, crs= "EPSG:4326",geometry="geometry")
aoi_gpd.explore(style_kwds={"fillOpacity": 0}, color="black", name="AoI", m=m)
folium.LayerControl(collapsed=False).add_to(m)
m
Step 4: Load the model#
experiment_name = "WF2_unetv2_bgriswirs"
subfolder_local = f"models/{experiment_name}"
config_file = hf_hub_download(repo_id="isp-uv-es/ml4floods",subfolder=subfolder_local, filename="config.json",
local_dir=".", local_dir_use_symlinks=False)
model_file = hf_hub_download(repo_id="isp-uv-es/ml4floods",subfolder=subfolder_local, filename="model.pt",
local_dir=".", local_dir_use_symlinks=False)
inference_function, config = load_inference_function(subfolder_local, device_name = 'cpu', max_tile_size=1024,
th_water=0.5, th_brightness=3500,
distinguish_flood_traces=True)
channel_configuration = config['data_params']['channel_configuration']
channels = get_channel_configuration_bands(channel_configuration, collection_name='S2')
def predict(input_tensor, channels = [1, 2, 3, 7, 11, 12] ):
input_tensor = input_tensor.astype(np.float32)
input_tensor = input_tensor[channels]
torch_inputs = torch.tensor(np.nan_to_num(input_tensor))
return inference_function(torch_inputs)
Loaded model weights: models/WF2_unetv2_bgriswirs/model.pt
Getting model inference function
Step 5: Download the images, run inference and vectorize the outputs#
COLORS_PRED = np.array([[0, 0, 0], # 0: invalid
[139, 64, 0], # 1: land
[0, 0, 240], # 2: water
[220, 220, 220], # 3: cloud
[60, 85, 92]], # 5: flood_trace
dtype=np.float32) / 255
band_names_S2 = get_channel_configuration_bands(channel_configuration, collection_name='S2', as_string=True)
path_to_export = "cache_s2"
os.makedirs(path_to_export, exist_ok=True)
floodmaps = {}
for i in tqdm(range(n_images_col), total=n_images_col):
s2data = img_col_info_local.iloc[i]
if s2data.cloudcoverpercentage > 50:
continue
date = s2data.solarday
filename = os.path.join(path_to_export,f"albania_ts_{date}.tif")
filename_pred = os.path.join(path_to_export,f"albania_ts_{date}_pred.tif")
filename_jpg = os.path.join(path_to_export,f"albania_ts_{date}.jpg")
filename_gkpg = os.path.join(path_to_export,f"albania_ts_{date}.gpkg")
# Download S2 image
if not os.path.exists(filename):
asset_id = f"{s2data.collection_name}/{s2data.gee_id}"
geom = s2data.geometry.intersection(area_of_interest)
postflood = ee_image.export_image_getpixels(asset_id, geom, proj=s2data.proj,bands_gee=band_names_S2)
save_cog(postflood, filename, descriptions=band_names_S2)
else:
postflood = RasterioReader(filename).load()
# Run inference
if not os.path.exists(filename_pred):
prediction_postflood, prediction_postflood_cont = predict(postflood.values, channels = list(range(len(band_names_S2))))
prediction_postflood_raster = GeoTensor(prediction_postflood.numpy(), transform=postflood.transform,
fill_value_default=0, crs=postflood.crs)
save_cog(prediction_postflood_raster, filename_pred, descriptions=["floodmap"])
else:
prediction_postflood_raster = RasterioReader(filename_pred).load().squeeze()
# Plot
fig, ax = plt.subplots(1,2,figsize=(14,4.75), tight_layout=True)
plot.show((postflood.isel({"band": [4,3,2]})/3_500).clip(0,1), ax=ax[0], add_scalebar=True)
ax[0].set_title(f"{s2data.satellite} {s2data.solarday}")
plot.plot_segmentation_mask(prediction_postflood_raster, COLORS_PRED, ax=ax[1],
interpretation_array=["invalids", "land", "water", "cloud", "flood-trace"])
ax[1].set_title(f"{s2data.solarday} floodmap")
plt.show(fig)
fig.savefig(filename_jpg)
plt.close(fig)
# Vectorize the predictions
postflood_shape = vectorize_outputv1(prediction_postflood_raster.values,
prediction_postflood_raster.crs,
prediction_postflood_raster.transform)
floodmaps[s2data.solarday] = postflood_shape
postflood_shape.to_file(filename_gkpg, driver='GPKG')
0%| | 0/18 [00:00<?, ?it/s]

6%|███████▎ | 1/18 [01:20<22:45, 80.30s/it]

11%|██████████████▌ | 2/18 [02:41<21:30, 80.66s/it]

44%|██████████████████████████████████████████████████████████▏ | 8/18 [04:16<04:26, 26.62s/it]

50%|█████████████████████████████████████████████████████████████████▌ | 9/18 [05:43<05:29, 36.60s/it]

72%|█████████████████████████████████████████████████████████████████████████████████████████████▉ | 13/18 [07:08<02:25, 29.15s/it]

78%|█████████████████████████████████████████████████████████████████████████████████████████████████████ | 14/18 [08:33<02:29, 37.45s/it]

89%|███████████████████████████████████████████████████████████████████████████████████████████████████████████████████▌ | 16/18 [10:00<01:18, 39.19s/it]

94%|██████████████████████████████████████████████████████████████████████████████████████████████████████████████████████████▊ | 17/18 [11:30<00:48, 48.07s/it]

100%|██████████████████████████████████████████████████████████████████████████████████████████████████████████████████████████████████| 18/18 [12:51<00:00, 42.88s/it]
Step 6: Show vectorized floodmaps and S2 images in an interactive map#
In the final step we show the vectorized floodmaps over an interactive map using the geemap package.
Map = geemap.Map(location=area_of_interest.centroid.coords[0][-1::-1],
zoom_start=8)
aoi_gpd.explore(style_kwds={"fillOpacity": 0}, color="red", name="AoI", m=Map)
warnings.filterwarnings("ignore", "is_categorical_dtype is deprecated ", FutureWarning)
categories = ['water', 'cloud','flood_trace']
COLORS = {
'cloud': "gray",
'flood_trace': "turquoise",
'water': "blue"
}
cmap = matplotlib.colors.ListedColormap([COLORS[b] for b in categories])
imgs_list = img_col.toList(n_images_col, 0)
for i in range(n_images_col):
s2data = img_col_info_local.iloc[i]
if s2data.cloudcoverpercentage > 50:
continue
img_show = ee.Image(imgs_list.get(i))
date_iter = s2data.solarday
Map.addLayer(img_show,
{"min":0, "max":3000,
"bands":["B11","B8","B4"]},
f"{date_iter} S2 SWIR/NIR/RED",
True)
floodmap = floodmaps[date_iter]
name = f"FloodMap {date_iter}"
floodmap[floodmap["class"] != "area_imaged"].explore(m=Map, column="class", cmap=cmap, categories=categories, name=name,
style_kwds={"fillOpacity": 0.3},show=False)
folium.LayerControl(collapsed=False).add_to(Map)
Map
Licence#
The ML4Floods package is published under a GNU Lesser GPL v3 licence
The WorldFloods database and all pre-trained models are released under a Creative Commons non-commercial licence. For using the models in comercial pipelines written consent by the authors must be provided.
The Ml4Floods notebooks and docs are released under a Creative Commons non-commercial licence.
If you find this work useful please cite:
@article{portales-julia_global_2023,
title = {Global flood extent segmentation in optical satellite images},
volume = {13},
issn = {2045-2322},
doi = {10.1038/s41598-023-47595-7},
number = {1},
urldate = {2023-11-30},
journal = {Scientific Reports},
author = {Portalés-Julià, Enrique and Mateo-García, Gonzalo and Purcell, Cormac and Gómez-Chova, Luis},
month = nov,
year = {2023},
pages = {20316},
}
Acknowledgments#
This research has been supported by the DEEPCLOUD project (PID2019-109026RB-I00) funded by the Spanish Ministry of Science and Innovation (MCIN/AEI/10.13039/501100011033) and the European Union (NextGenerationEU).


